Using FOIA to verify FOIA: 2008 to 2015 Department Deviations to Evaluate FOIA Averages and Forecast the Future
Description:
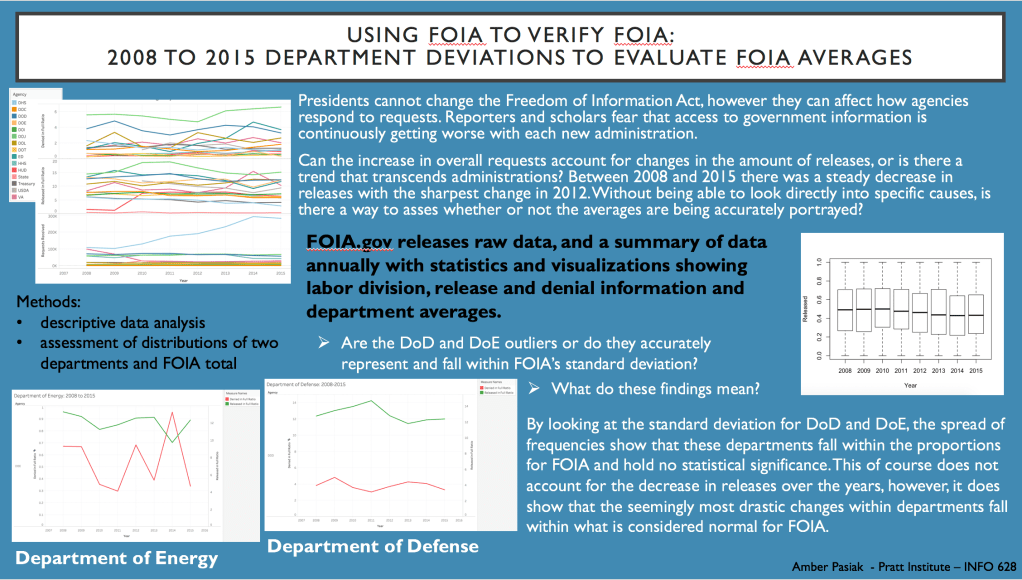
FOIA is used to help the general public gain access to government documents and information. Many reporters and scholars have feared that the performance of FOIA has gotten worse over the years. By looking at the annual FOIA summaries released from the Department of Justice and raw data from the years 2008 to 2015, a comparison and analysis can be done to check the FOIA reports. This is important because it enables one to verify the performance of a government act that is there to provide verification, transparency and accountability to the government. It also allows one to test the legitimacy of predictions made by scholars and journalists to the declining nature of FOIA. This project uses raw data on FOIA to analysis these questions. The project also contains a data management plan and my code to showcase a standardized work flow in order to promote open sharing, reuse, reproducibility and preservation.
Project from: Pratt Institute, INFO 628: Data Librarianship
Methods
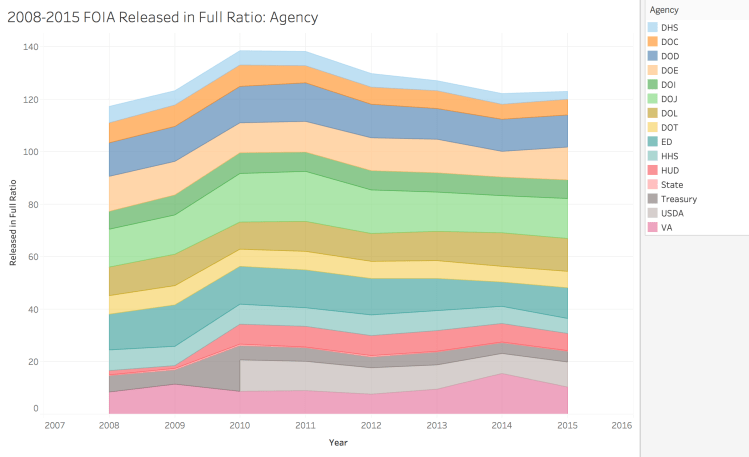
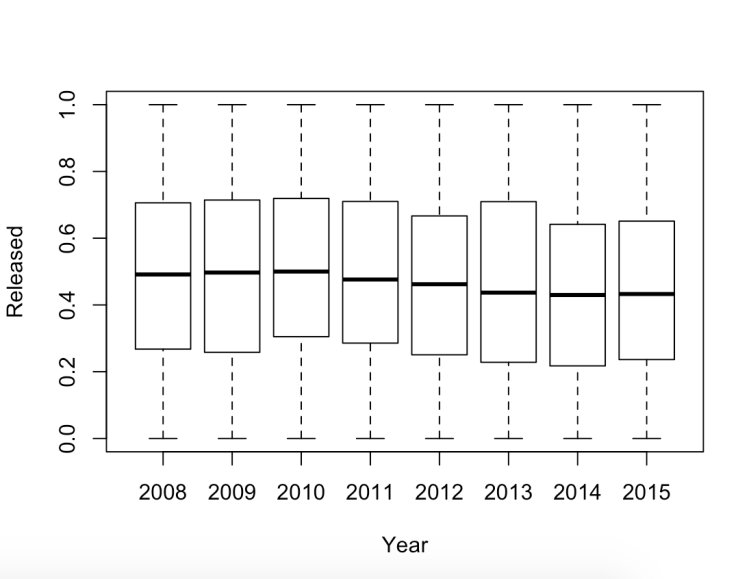
I began this project by attempting to decipher if there was a statistical significance between the time taken for full FOIA requests released between former President Obama and current President Trump. A quantitative analysis of this kind could not be completed due to time constraints and the raw data available. Instead, this project used R Studio and Tableau to look at two specific departments between the years 2008 to 2015, to investigate trends in comparison to FOIA averages. By investigating these two departments and comparing them to the whole, I was able to use FOIA data to check the FOIA summary report and make a calculated prediction for the future.
The data used is from the open access website Kaggle. The dataset is in the public domain and is owned by the Department of Justice.
For this project, along side analysizing data, I also conducted research on government documents, FOIA and cause and effect of FOIA release differences.
After completing the research and analysis I created a Data Management Plan, although some of the tasks outlined were not completed, the plan showcases my understanding of best practices for. open data and continued research.
My Role
I am the sole creator of this project.
Learning Outcome Achieved
Technology
Rationale
This project shows my understanding of multiple programming languages and effective use of them. I was able to locate, download and analyze an open data set. With this, I used a variety of digital tools to organize the data set, promote its future access, retrieval and use through a Digital Management Plan and create visualizations of the information found. This project exemplifies my troubleshooting skills as well as my use of digital tools and resources.
Download and explore materials here:
Data Management Plan:
Data Collection – Data collected from government websites, such as FOIA.gov, and open data websites, such as Kaggle. The data available for this project is open to the public. Future projects can collect data also from these sites but must be mindful of variables used in terms of project comparison.
Forms and Formats – The relevant information will be downloaded as a csv. file in order to be compliant for exporting and importing into RStudio as well as other programs. File names will be in YYYY-MM-DD__INFO format. The workflow will also be clean and organized in a manner that will be conducive to sharing.
Data storage, management and preservation – The raw and analyzed data will ideally be saved with the 3-2-1 preservation rule, although it will most likely just be 2 separate locations. Files will be saved on a hard drive using R Markdown and in an online cloud or database. Possibilities for a DOI for archiving and preservation purposes are being considered.
Metadata – Through the R Markdown file I would like to include presidential information, department information, linked data to the websites that supplied the raw data, and my analysis of the findings. I would also like to create a README or TXT file that contains pertinent information about the data and how it was collected. The codebook will also be in a TXT file and also in the R Markdown file. Visualizations will also have all relevant information for most arcuate reading to public.
Sensitive Data – N/A
Data Sharing – As the raw data is already open to the public, my analysis and process would be what is available to share. I will use Google Drive in order to make the data discoverable and reusable. As stated above, I will also make sure that all files are created and saved with the proper file name for easy sharing. All future data for comparison and analysis should follow the same guidelines.
